This is a nice fun little data engineering project idea that you can do in Python – tracking the International Space Station and visualising its path across the globe using Looker Studio (formerly Google Data Studio).
We’ll be using Python 3.10 and we will be hosting the project in Google Cloud.
Right now as I write this, you can set yourself up on Google Cloud (you’ll need a Gmail account and a payment method) and they’ll give you $300 of credit allowing you the freedom to learn about their various products without getting charged. Once you have used up that credit then normal rates will apply based on your usage, however there remains some generous free tiers that reset monthly.
I have long since used up my free credit but this project remains free to run each month as I do not exceed my free tier allowance.
ISS Tracker Data Engineering Project Idea Overview
The data pipeline project will go something like this:
- Write a Python Google Cloud Function to query an API every 1 minute to retrieve the position of the ISS
- Use the Pydantic library to parse the data returned
- Store its position including current date and time into Google BigQuery
- Present visuals using Looker Studio showing the path of the ISS over the earth.
The ISS orbits the earth every 90 minutes so we can generate a nice amount of data over a day. Due to the speed of the ISS orbiting the earth, the map can get quickly overwhelmed with plot points so a way to keep the map tidy will need to be established once you have finished setting this up. You could create a filter or delete the data based on a schedule. That’s not in scope of this post however.
For this project, to get started you will need:
- A Google Cloud Account
- A Google Cloud Project
- A Google Project to manage your cloud resources (cloud functions, BigQuery etc) under.
- A suitable Python editor (optional). I use Microsoft VS Code
Setting up your environment, a Google Cloud account including billing and the project in Google Cloud is outside the scope of this post. Just a little bit of advice here though, you can technically skip establishing a development environment locally on your workstation and add Python directly into the Google Cloud Function.
Here is a simplified diagram of what the ETL process will look like:
![]()
Enabling the Google Cloud API’s Required
In Google Cloud, there are API’s for everything and for this project we need to enable a number of them to activate the required resources that we want to utilise.
We will be activating:
- Cloud Functions API
- Pub/ Sub API
- BigQuery API
Enabling the Google Cloud API’s
All API’s can be found under the navigation menu on the left hand side.
Click “View All Products” and then find “APIs and Services”.
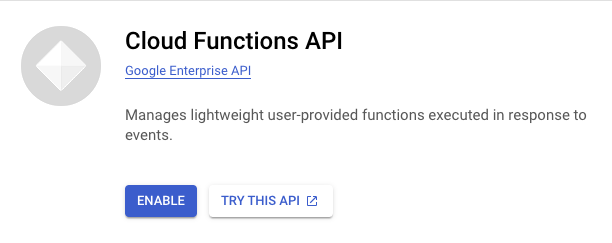
For each API, click “Enable API”, like in this example:
Setting up the BigQuery Objects
BigQuery Data Set Creation
You’ll need a table to store your data. Tables are created in “Data Sets” which are essentially schema’s.
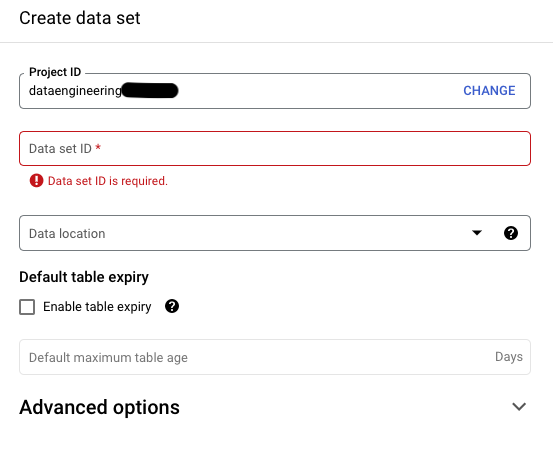
After accessing BigQuery, right click on your project name and click “Create data set”

Now enter a name for your data set and choose a location in the box provided. Try and keep locations the same for your resources selected as this can yield problems if they are different. Click the “Create data set” button
BigQuery Table Creation
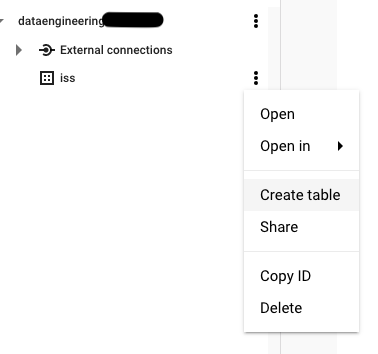
You’re ready to create your table next. Right click on your data set and choose “Create table”
You’ll be presented with a form in which you can create your table. Fill in the cells as I’ve defined and click “Create Table”
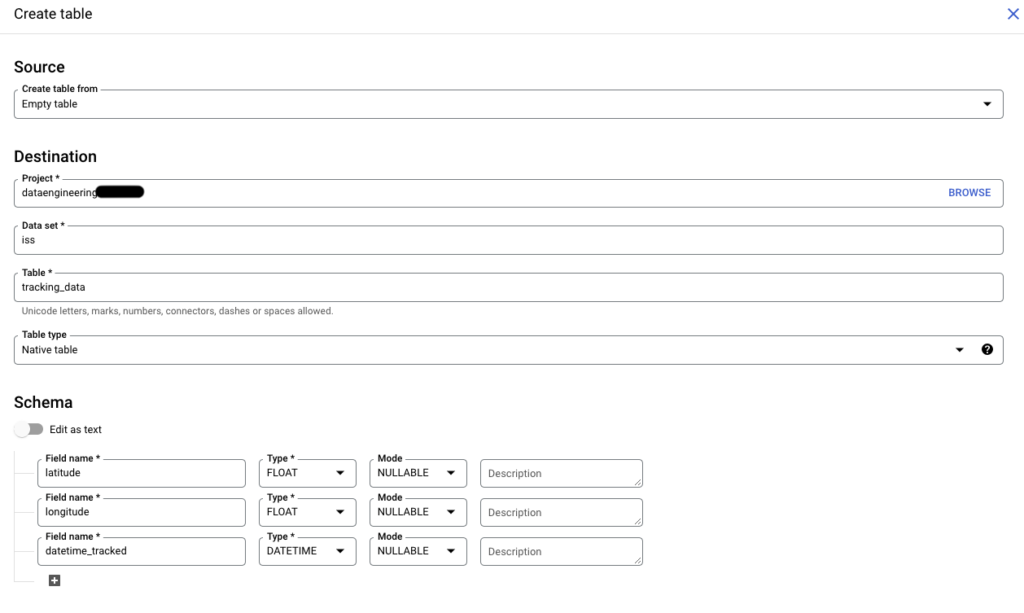
You should now see a table sitting under your data set in the navigation pane on the left. You’re now ready to create a topic in Pub/Sub.
Setting up Google Pub/Sub
Pub/Sub allows for an easy way for services to communicate. In this instance, we can create a topic which our cloud function will listen on. Any messages sent to the topic will trigger our cloud function code that will be tracking the ISS current position.
Find Pub/Sub in the navigation menu and click “Create Topic”. Provide a name for the topic and leave other options as they are. We will use this name as a reference for the Cloud Function trigger.
Setting up the Cloud Function
Google Cloud Functions are server-less, container-less pieces of code that perform a task. They can be triggered via a schedule or via an event. So for example you could write a cloud function to trigger when a file is uploaded to a bucket in Google Cloud Storage.
The type of cloud function we’ll be using for this is one which is triggered via a schedule. We’ll get to that part soon.
Deployment can be done directly in the web interface. Alternatively, you can use your Python editor provided that it is authenticated to Google Cloud. We’ll not be covering the editor method and instead we will deploy via the interface.
Creating the Cloud Function
This is the function that I have prepared for this project. I am using Pydantic to parse the data returned from the API before extracting the bits that I want from the JSON response. These are then inserted into my table in BigQuery. My error handling is basic. I am merely printing output to the console. You can of course do so much more with this but this is just for fun. 🙂
from pydantic import BaseModel, ValidationError
from datetime import datetime
from google.cloud import bigquery
import functions_framework
import requests
import json

@functions_framework.http
def get_iss_position(request):

    class SpaceStation(BaseModel):
        latitude: float
        longitude: float
        timestamp: datetime

    try:
        #retrieve the data from the iss tracker API
        api_response = requests.get("http://api.open-notify.org/iss-now.json")
        iss_position_json = json.loads(api_response.text)

        success_msg = iss_position_json["message"]
        if success_msg == "success":
            #extract the values from the JSON that we are interested in
            latitude = iss_position_json["iss_position"]["latitude"]
            longitude = iss_position_json["iss_position"]["longitude"]
            timestamp = iss_position_json["timestamp"]

            #validate the data returned via the SpaceStation class using Pydantic BaseModel
            SpaceStation = SpaceStation(latitude=latitude, longitude=longitude, timestamp=timestamp)

            # Insert values in a table
            client = bigquery.Client()
            dataset = "iss"
            table = "tracking_data"
            table_ref = client.dataset(dataset).table(table)
            iss_tracker_table = client.get_table(table_ref)
            # Creating a list of tuples with the values that shall be inserted into the table
            rows_to_insert = [(SpaceStation.latitude, SpaceStation.longitude, SpaceStation.timestamp)]
            errors = client.insert_rows(iss_tracker_table, rows_to_insert)
            return '{"status":"200", "data": "OK"}'
        else:
            return  '{"status":"200", "data": "Failed to retrieve ISS data"}'

    except ValidationError as e:
        print(e.json())

    except Exception as e:
        print(str(e))
At the top of the function are the library references. After installing these, I am left with a fairly substantial list of requirements. The cloud function will also require this list saved as requirements.txt.
cachetools==5.2.0
certifi==2022.9.24
charset-normalizer==2.1.1
click==8.1.3
cloudevents==1.6.2
deprecation==2.1.0
Flask==2.2.2
functions-framework==3.2.0
google-api-core==2.10.2
google-auth==2.14.0
google-cloud-bigquery==3.3.6
google-cloud-bigquery-storage==2.16.2
google-cloud-core==2.3.2
google-crc32c==1.5.0
google-resumable-media==2.4.0
googleapis-common-protos==1.56.4
grpcio==1.50.0
grpcio-status==1.50.0
gunicorn==20.1.0
idna==3.4
install==1.3.5
itsdangerous==2.1.2
Jinja2==3.1.2
MarkupSafe==2.1.1
numpy==1.23.4
packaging==21.3
proto-plus==1.22.1
protobuf==4.21.9
pyarrow==10.0.0
pyasn1==0.4.8
pyasn1-modules==0.2.8
pydantic==1.10.2
pyparsing==3.0.9
python-dateutil==2.8.2
requests==2.28.1
rsa==4.9
six==1.16.0
typing_extensions==4.4.0
urllib3==1.26.12
watchdog==2.1.9
Werkzeug==2.2.2
Now that I have my code and requirements.txt list, I can deploy this to the cloud infrastructure.
Find Cloud Functions in the navigation menu and click “Create Function”. At this point, enable any missing API’s when prompted. Choose Python 3.10 from the lists of available languages.
Your next screen will be something like this. Choose Pub/Sub as the trigger type and the topic will be the one you just created. Memory allocated for this function was set to 256Mb. This seemed to run fine. Ensure that the region matches your BigQuery data set region, otherwise the function may fail to execute.
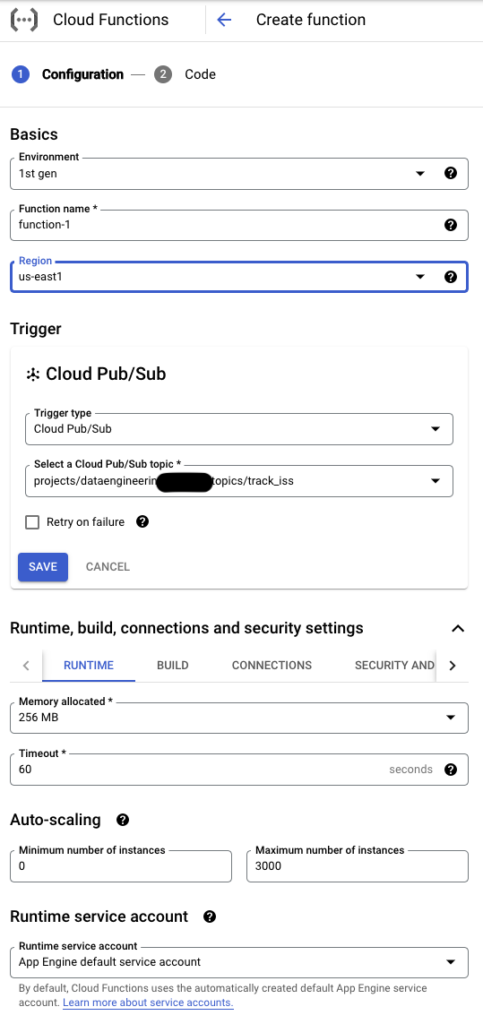
When you’re done, click “Deploy”. It will take a couple of minutes to complete.
To test the function, create a message inside your pub/sub topic by clicking the “Publish Message” button.
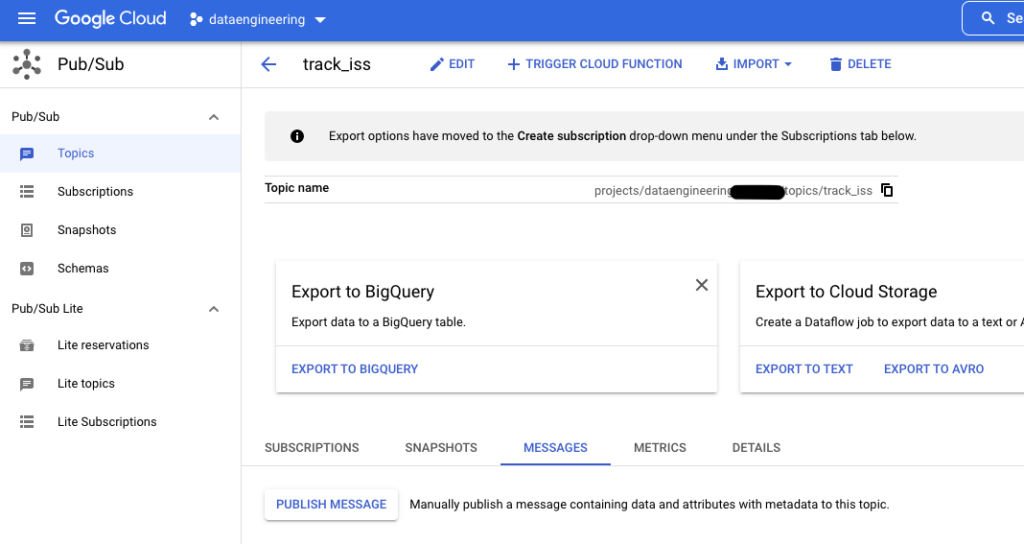
If the function was successful then you will have a new row in your table inside of BigQuery.
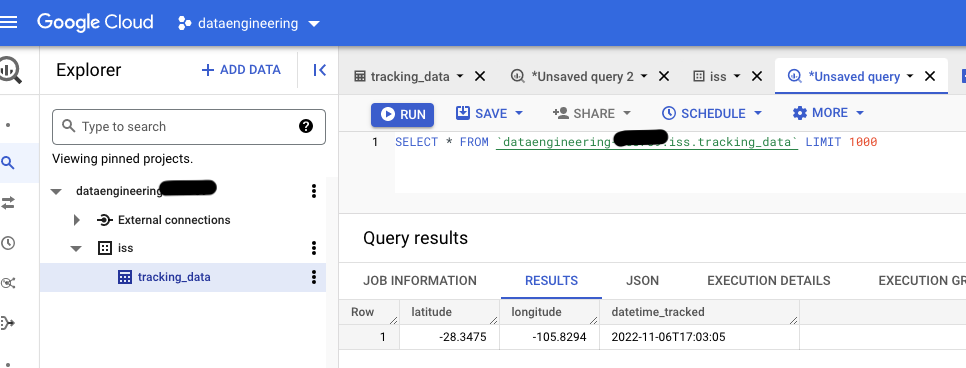
Setting up a Schedule for the Cloud Function
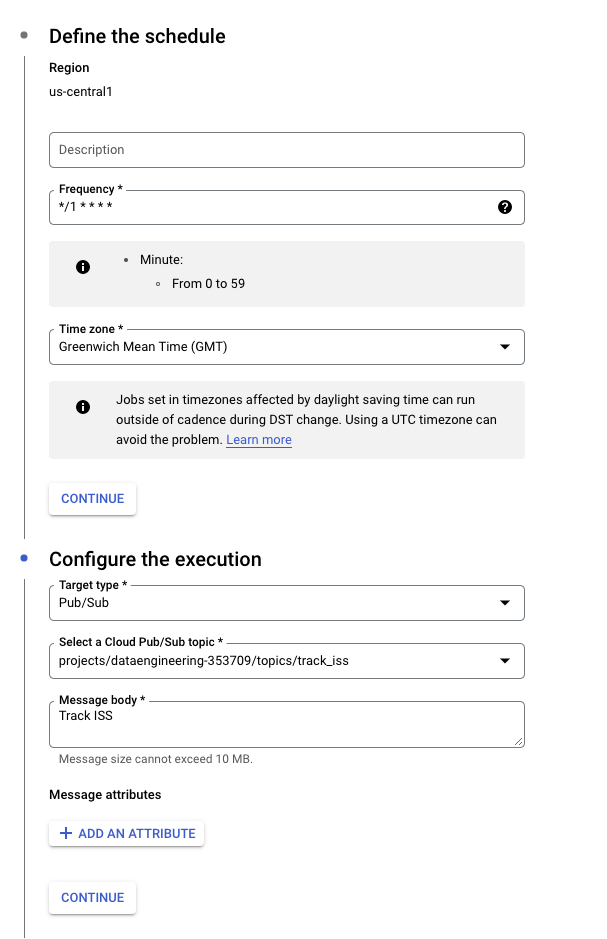
Having validated that the Cloud Function is being called correctly and storing data, it is now possible to create a schedule for it to capture more data points. As the ISS is orbiting so fast, it is necessary to run the function often. I have set mine to run every minute.
Goto “Cloud Scheduler” in the navigation on the left hand side and create your schedule to these settings, matching to your pub/sub topic names accordingly.
Setting up Looker Studio to Query the Captured Data
We’re now in a position to visualise our data. Once you’re in Looker Studio, create a new blank report and add a BigQuery Google Connector from the list of available sources.
From here, choose your project from the left hand side and then the data set containing your tracking table and click “Add” and click “Add to Report” if again prompted.
Your new report will initially be loaded with a grid of data on the page. The available fields in the data source are on the right hand side.
We will be presenting the data on a map. The available fields do not contain the correct data type so we need to build this as a special custom field.
Click “Resource” from the top menu bar and then click “Manage added data sources”.
Click the “Edit” button of your data source containing your ISS tracking data and you’ll see a list of fields.
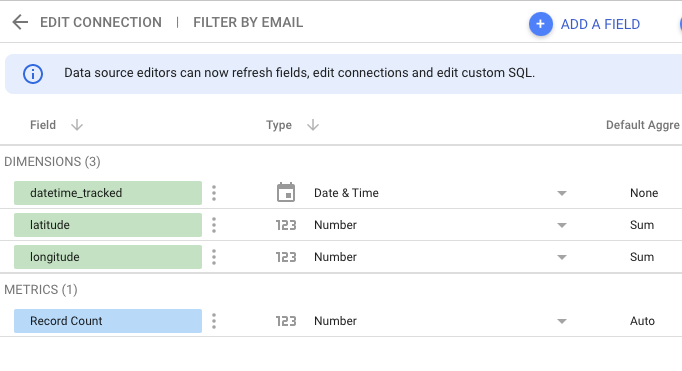
Click “Add a Field”
In the formula box, add this bit of code:
CONCAT(latitude, ",", longitude)
Give the new field a name and click “Save”. Your new field will appear. Change it’s type to Geo->Latitude, Longitude
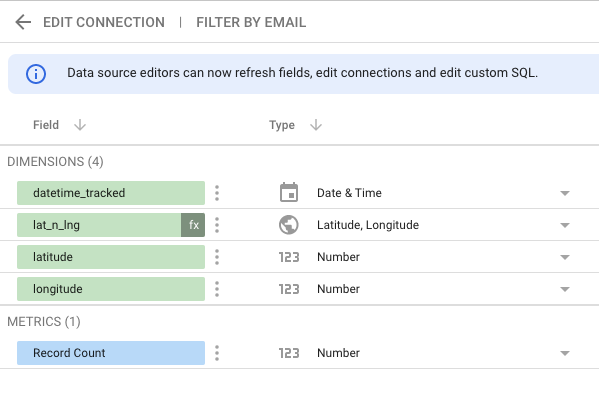
You’re now ready to add the map. Remove the existing grid and find the bubble map chart from the menus. Drag one of these onto the canvass and add the new custom field into the location dimension. This will plot the positions of the ISS onto the map.
![]()
And that’s it. I hope you enjoyed following through this one. It’s nice project to help get familiar with Google Cloud and some data pipeline techniques. 🙂